Dashboard on 4 weeks
Because it makes Pieter happy — and it’s a great idea!
Pieter Levels is one of our most supportive customers. He recently asked us to add an option to display the dashboard on 4 weeks.

Our response
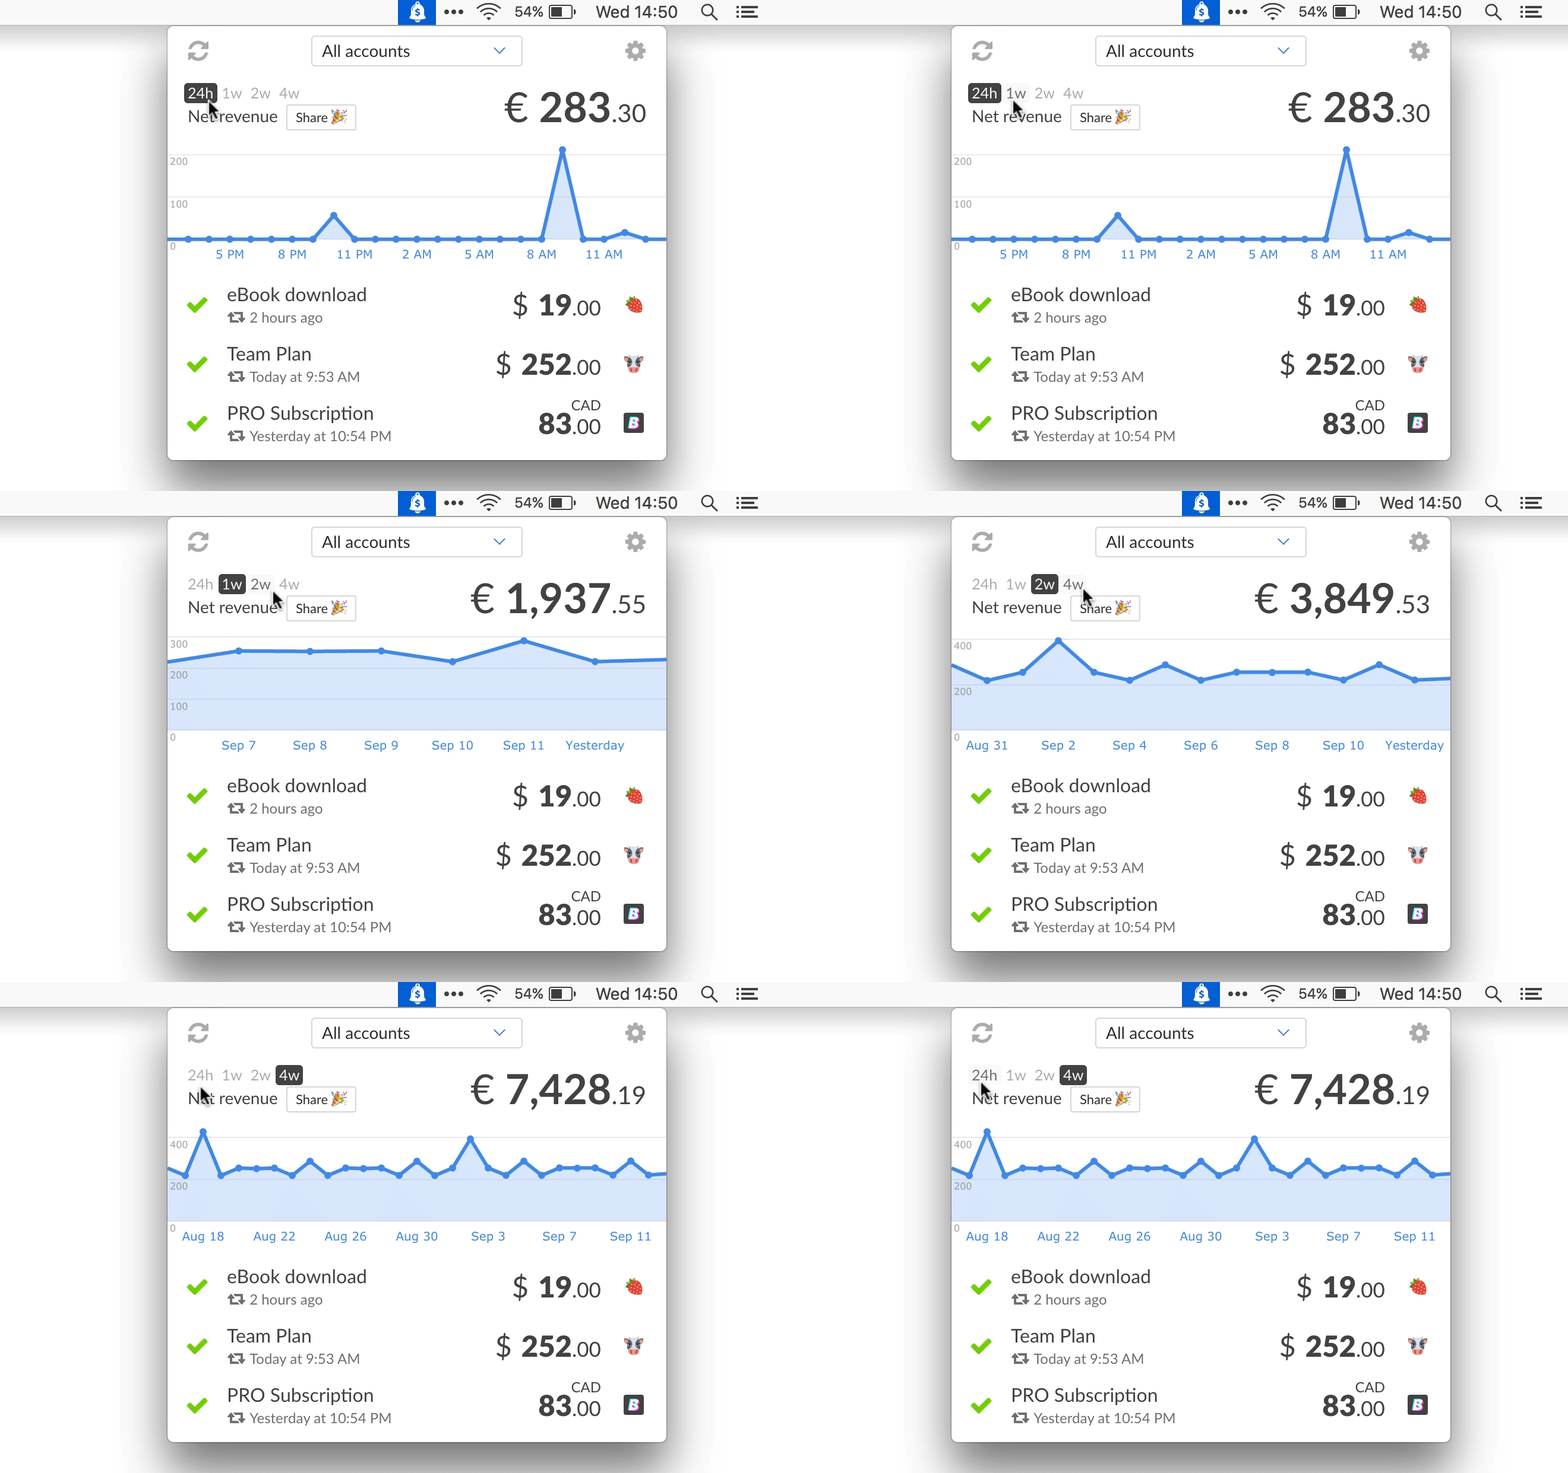
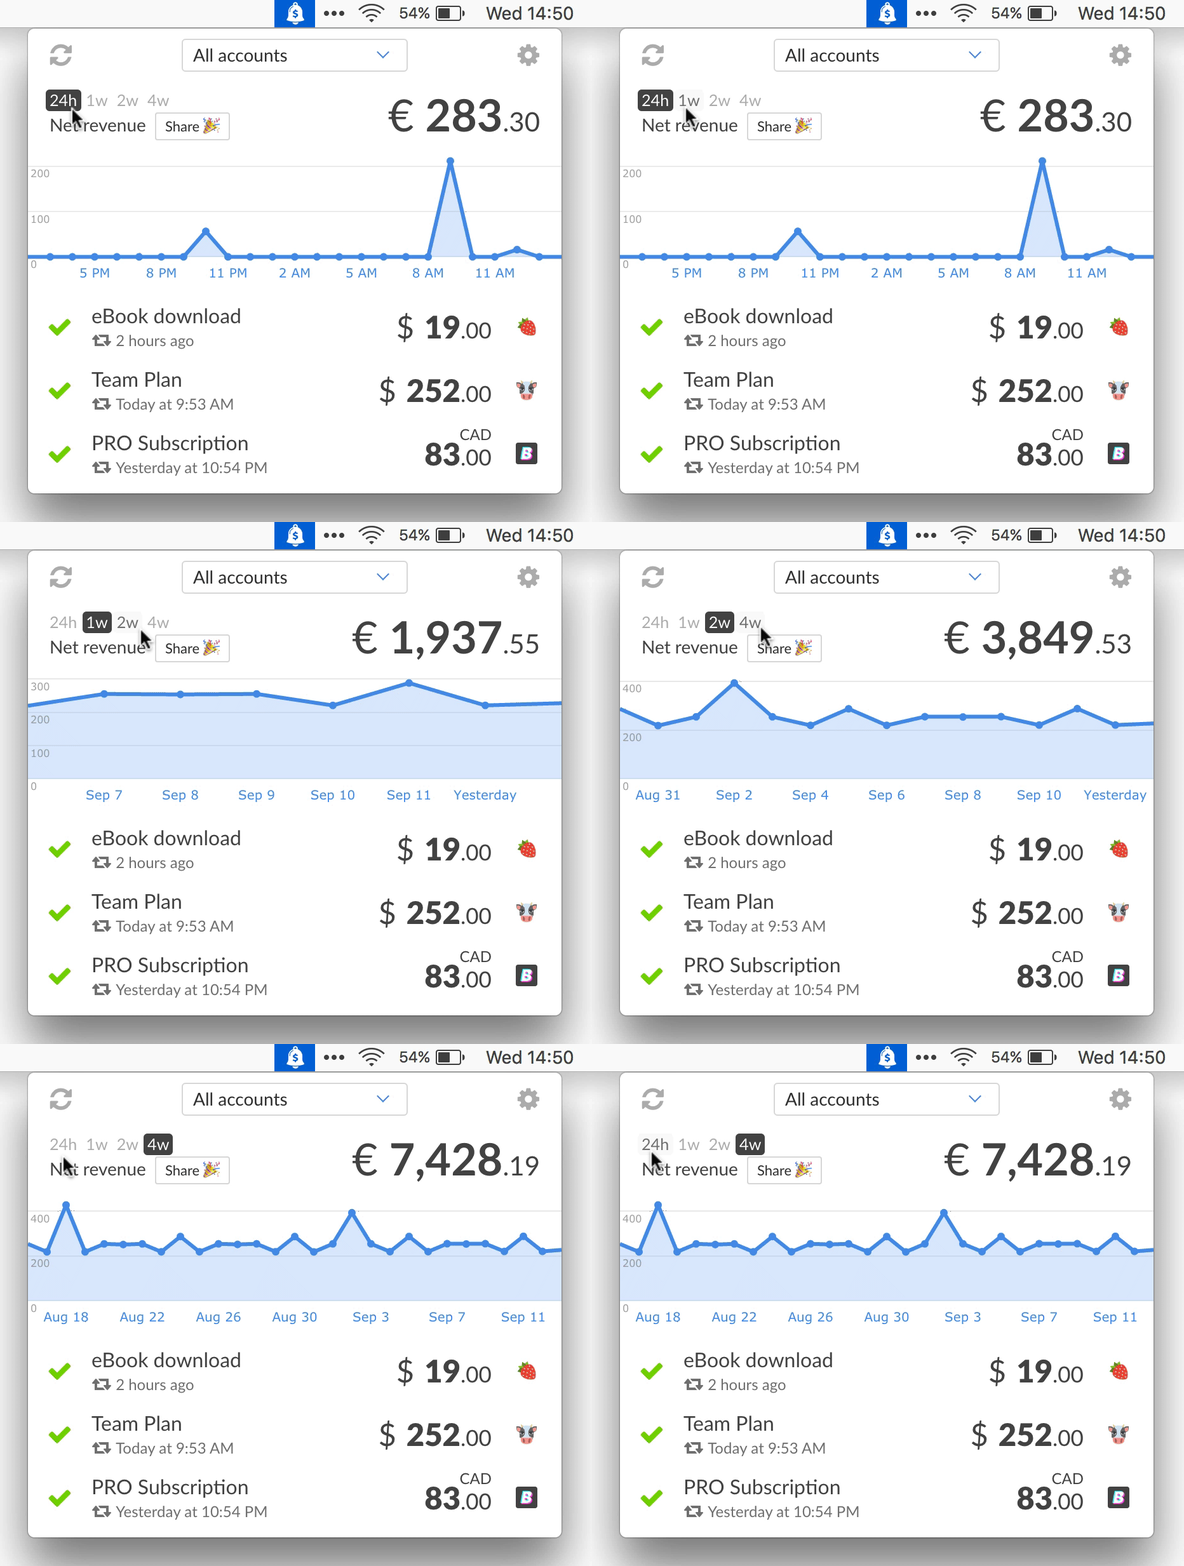
We did it 💪, here is how it looks:


The new graph has 29 points: today and 28 days before.
The new total matches the graph. As a result, its precise time frame is somewhere between 28 and 29 days, depending on the hour of the day.
Release
This feature was first shipped to customers who activated pre-releases in their “Updates” tab on September 14, 2017 (2.2.4-beta).

It became available to all customers on September 26, 2017 (2.4.5).
We’re excited that you try it out, let us know what you think! ❤️

